If you deal with the investment of money on the stock market, you will encounter numerous tools that provide you with evaluations and statistics. As a big Excel/Google Sheets fan I love to tinker with individual evaluations. In this article I would like to show you which reports you can create with the help of Google Sheets.
Google offers own functions in Google Sheets through their service “Google Finance”. You can use these functions to create very comfortable reports.
Show price changes of the last few days
First of all, it may be interesting to see how a stock has performed in the last 24 hours, 7 days, last month and last year. To evaluate this, you can use the function GOOGLEFINANCE():
=GOOGLEFINANCE(ticker, [attribute], [start_date], [end_date|num_days], [interval])In other words, for example, if I want to know the price of Google’s stock over the last 7 days:
=GOOGLEFINANCE("ETR:ABEA";"price";TODAY();TODAY()-7)“ETR:ABEA” is the symbol of the share consisting of the trading venue (ETR = Xetra see Wikipedia) and the abbreviation (ABEA) If you do not know the symbol, the easiest way to search for “company name stock” is to use Google. There you will get it displayed.
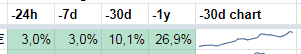
Unfortunately the function displays the values in several cells. This is quite nice for some evaluations. But for a stock overview it is rather annoying. If you only want to display the share price development in percent, the index function of Google Sheets helps.
=GOOGLEFINANCE("ETR:ABEA";"price")/INDEX(GOOGLEFINANCE("ETR:ABEA";"price";TODAY()-7);2;2)-1If you want to display the price trend visually, you can use the “Sparkline” function to render the chart directly into a table cell.
=SPARKLINE(GoogleFinance("ETR:ABEA"; "price"; TODAY()-7; TODAY()))The best thing is that the functions automatically update the whole spreadsheet, meaning that you always calculate with relatively current prices.
Highs and Lows and the P/E ratio
The GOOGLEFINANCE function can return not only the current share price, but also other data about a company and the development of the share price. Unfortunately this data is not always maintained.
On the description page of the function (https://support.google.com/docs/answer/3093281), there are numerous indicators that can be used to do wonderful things.
But what I really helpful is “high52” and “low52”, with which you can read out the highest or lowest value of the last 52 weeks. This gives a good insight into the volatility.
=GOOGLEFINANCE("ETR:ABEA";"high52")Equally interesting is the current market capitalisation with the indicator “marketcap”. This makes it easier to compare company valuations. Something like this, for example:
“Is Tesla really worth half as much as Volkswagen? …Is anyone under or overvalued?”
Can be answered with Google Sheets.
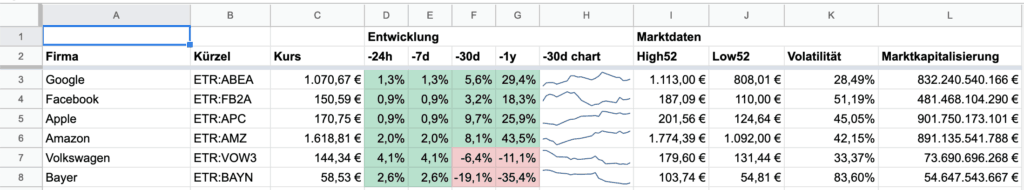
Visually arrange the evaluation of the shares
One of the most important functions for creating helpful evaluations with a spreadsheet is “conditional formatting”. This function allows you to color the rates accordingly. Thus, a negative development can be marked with red and positive developments with green background.
In my evaluation I have also set target prices where a buy/sell makes sense. There I use a traffic light system with the help of conditional formatting. So you can see directly which shares are worth a look and which are not.
Furthermore, it is also great to create visual evaluations in sheets with the help of the chart function. Especially if you want to show the asset allocation of your own portfolio, for example. Functions can be used here, for example, to show at which points your own strategy currently requires redistribution.
Demo: Practical testing
You can already do quite a lot with Google sheets. In addition, you can also develop missing functions. For example, I have written a small extension that gives me the current crypto courses (more about this when the opportunity arises).
If you are interested, you can get a copy of a sample document from me here.
Hi. That’s a great tool, I’ll use most of it to track my stocks. There’s just one point that I would like to know if you could help me with: is it possible to track third-party technical analysis for a given stock AND select the desired timeframe for it?
e.g.: investing.com/equities/google-inc-c-technical gives us the current (hourly) techincal analysis, which can be extracted to a Google Sheets using importxml or importhtml, piece of cake. But is there a way to render the monthly analysis instead?
Thank you!
Hi @tobisell, sehr spannend. bin gerade ebenfalls am aufbauen. Wie hast du es geschafft Crypto Währungen mit rein zu bekommen ? Danke für den Input. Gruss tobias 🙂