For the last three years, I have been working more intensively on the topic of the user journey or customer journey. This is based on the realization that it is difficult to predict user behavior. Therefore, you have to rely on an iterative process of measuring, learning and building. It’s helpful to have a KPI dashboard that maps the user journey and that you can use to guide your decisions.
In this post, I will show you how to build such a customer journey tracking dashboard with the help of Google Data Studio.
How do I capture the customer journey
The basis for a customer journey dashboard is an understanding of the user journey as expected by the user. This can always be supplemented by different touchpoints and steps, but basically the user journey consists of at least the following steps:
- Awareness
The user must hear about the product somewhere and recognize their own need. - Engagement
We have to get the user to interact with our product. Otherwise, the solution won’t stick in the user’s mind and we won’t be able to build a basic trust. - Subscription
The goal of this step should be a small but strong commitment from the user. Such a commitment could consist of following the social media page or signing up for the newsletter, but also booking workshops or trial versions. From here on, the user can be clearly identified. - Excite
Once we know the user, we need to trigger an AHA or WOW moment that makes them convinced about the product. - Ascend
Convinced users can then be converted to paying users. - Retain
Can we keep the user “in line”? How can customer lifetime value be increased? - Advocate
Do we get users to actively recommend our product? Promote Brand Ambassadors.
Each of these steps can be assigned individual metrics and touchpoints that can be used to evaluate how well that part of the user journey is performing.
The goal is to identify where bottlenecks occur and where optimization measures are most effective.
I primarily use three tools for measuring – depending on the use case, it of course also makes sense to consult other sources.
The product for which I evaluate the customer journey is a classic SaaS solution. Therefore, I use the data from:
- Google Search Console: On the insights of the basic reach of my SEM activities for the State Awareness.
- Google Analytics: For the evaluation in the area of engagement.
- Own measurement points within my application/database for the phase of each user.
Capturing the user journey within the application
After a lot of back and forth, I decided to capture the user-specific data directly in the database of my application. This makes me independent of other approaches and is even the simplest. Because I have a handle on when an event occurs.
So I store important milestones from the user journey as a point in time in the user profile. These are usually:
- Time of registration
- Time of first login
- Second login after 24 hours
- Time of the 14th login (customer is really user! – WOW/ AHA has taken place)
- Time of Pro-Account Upgrade
How do I get the data into Google Data Studio
The data from Google Analytics and Google Search Console can be transferred directly to Data Studio with just a few clicks. With the own data it is more difficult.
I first tried to write my own connector for Google Data Studio, but in the end I decided that importing a Google Sheets file is much easier. In addition, one has a universal data format, which makes the evaluation in other tools also possible.
So to get the data into Google Data Studio via Google Sheets, you need three things:
- Endpoint to grab the data within my application.
- Job to fetch the data and write it to Google Sheet
- Google Sheets as a data source for Google Data Studio
Tapping the data within my application
This point will be different for each application. For me, it is an endpoint that returns the following data in JSON. The API endpoint returns there events for the last 24 hours.
{
"users": 51,
"activeUsers": 7,
"newUsers": 0,
"requests": 333,
"errors": 21,
"avgProcessing": 0.507146713611958,
"milestones": {
"registration": {
"count": 3,
"totalCount": 51,
"duration": 0
},
"setup": {
"count": 2,
"totalCount": 33,
"duration": 2.1459953703703705
},
"2ndLogin": {
"count": 1,
"totalCount": 13,
"duration": 13.432407407407407
},
"14thLogin": {
"count": 0,
"totalCount": 5,
"duration": 26.664166666666667
},
"upgrade": {
"count": 0,
"totalCount": 0,
"duration": 0
}
}
}
Fetch data and store it in Google Sheet
Normally I always create a small script in Google Docs. This time, however, I made it even easier for myself and used Integromat. The scenario I created should work in a similar way in other flow tools like Zarpier or IFTTT.
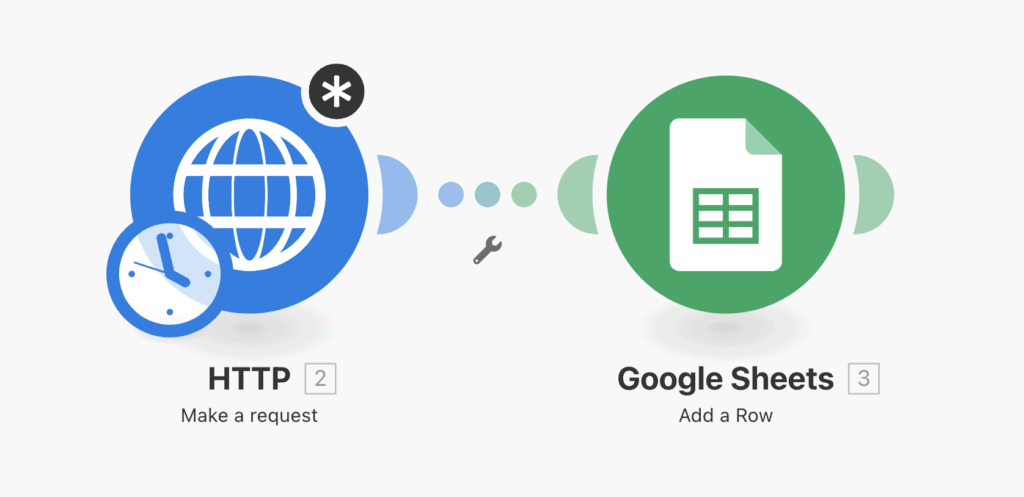
The whole scenario consists of only two elements. An HTTP request that is executed daily and a Google Sheets element that inserts the data accordingly.
The result is the following table, which can be used directly as a data source in Google Data Studio.
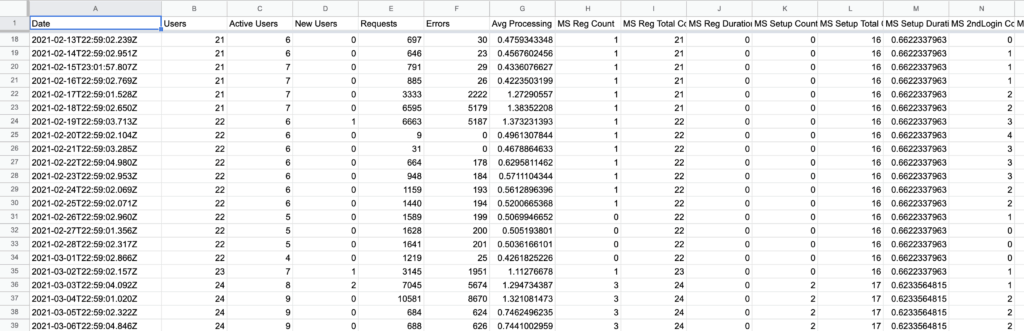
Google Sheets as data source for Data Studio
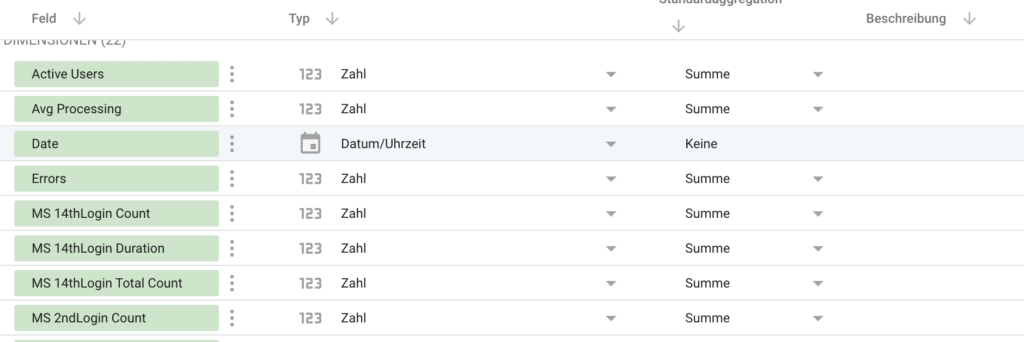
Under “Add data sources”, Google Sheets can be selected directly and linked to the corresponding file. The individual columns can then be imported accordingly.
For a correct evaluation, it is important that there is a date row in the Google Sheet that is also imported accordingly in Google Data Studio.
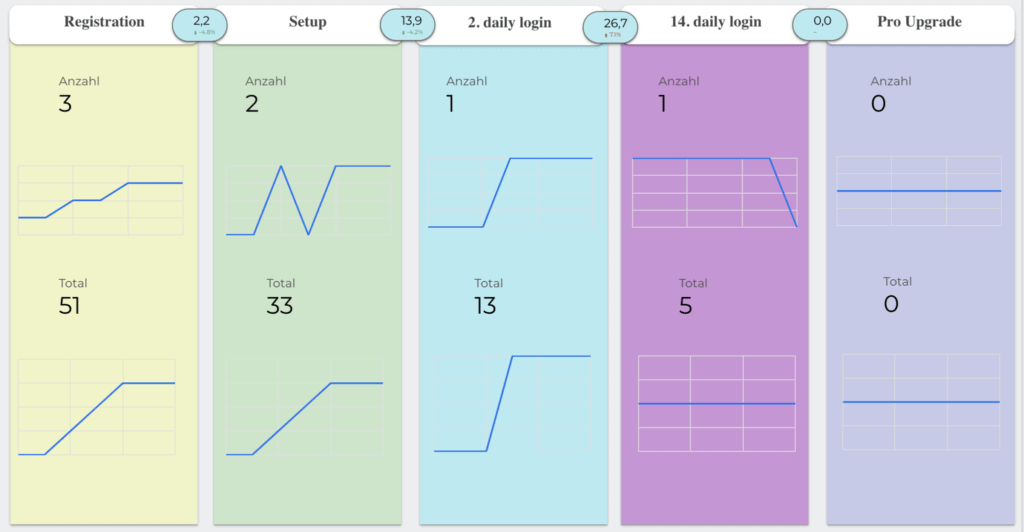
Then the data can be used in Data Studio with each chart and table.
For example, I have displayed the customer journey in columns and also display the elapsed time between the individual milestones. This is a good way to evaluate the extent to which the journey has been optimized over time.